01
Project Background
A Fortune 500 firm ran ~5 warehouses and a nationwide transport network in Australia — handling 200k+ shipments a year to ~50k delivery locations — while demand shifted from B2B toward B2C.
CAVE LAB · PROJECT SHOWCASE
Future-proofing a Fortune 500 firm's distribution network across Australia & New Zealand
A Fortune 500 firm ran ~5 warehouses and a nationwide transport network in Australia — handling 200k+ shipments a year to ~50k delivery locations — while demand shifted from B2B toward B2C.
We built a distribution-network redesign optimisation model from 18+ months of data (~2M order lines) and embedded it in an interactive app integrating warehousing, inventory and distribution decisions.
An interactive, cloud-deployed app (Python + Plotly Dash) uniting business analytics and network design — from demand and warehouse analysis to “true-north” end-to-end network optimisation and scenario simulation.
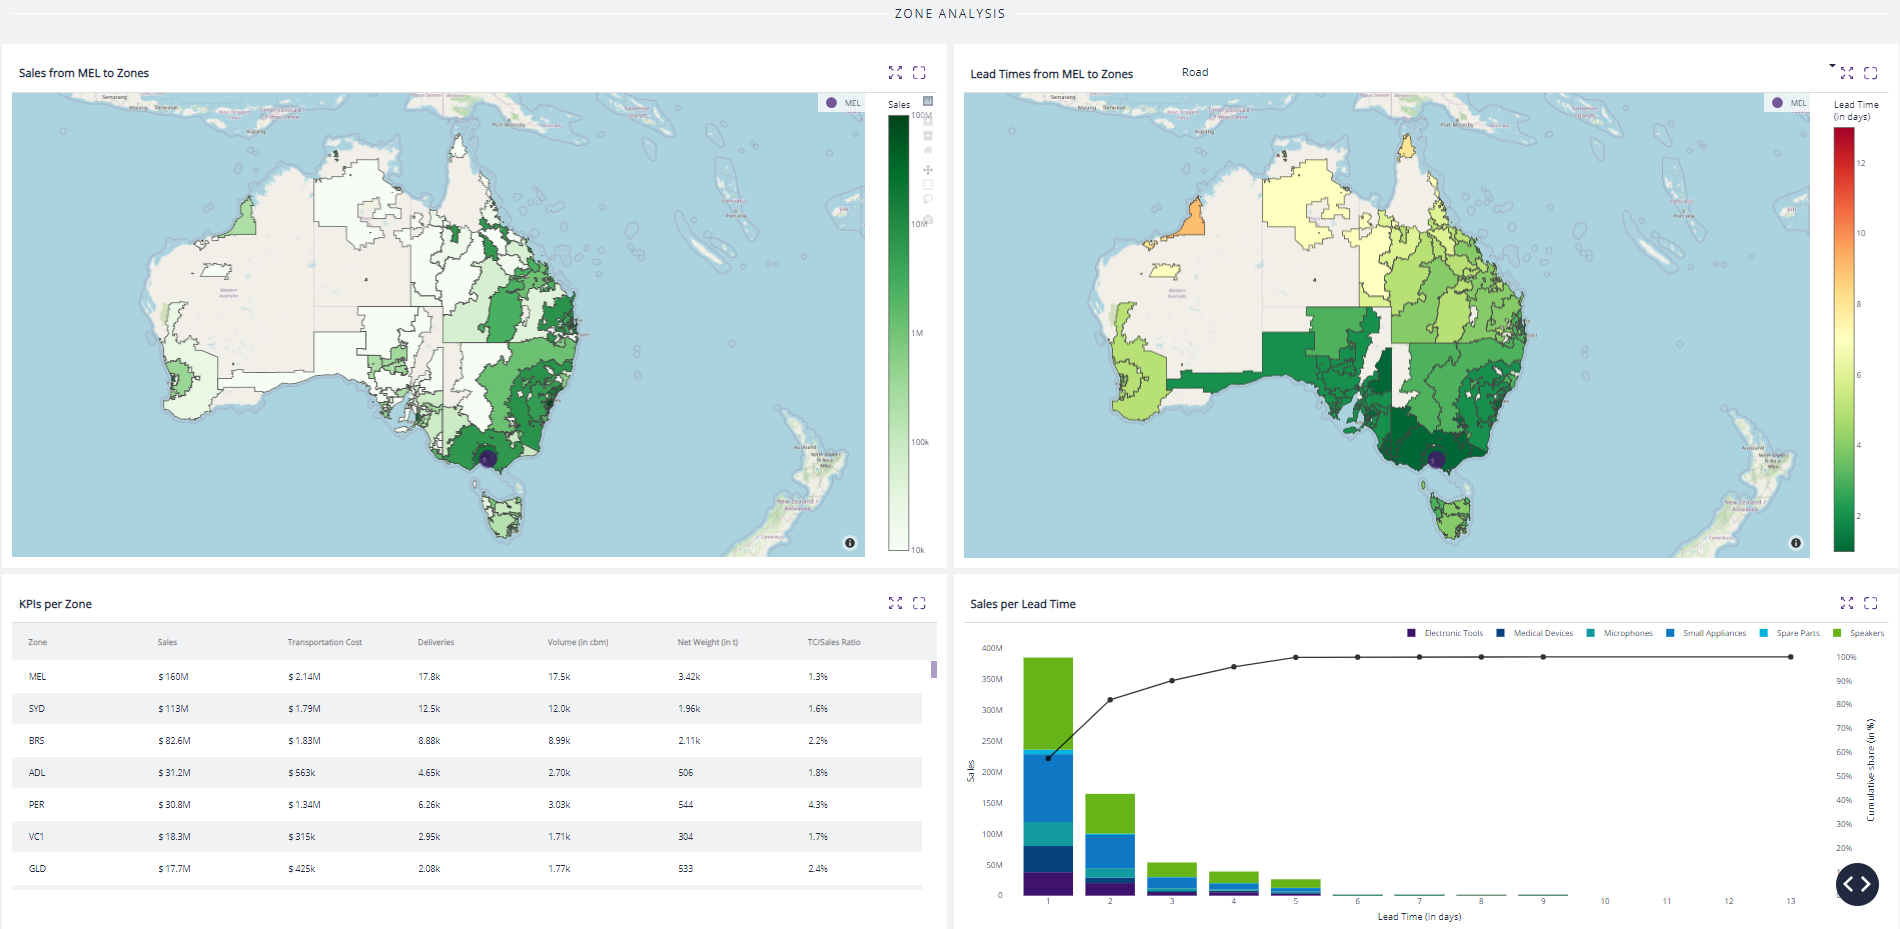
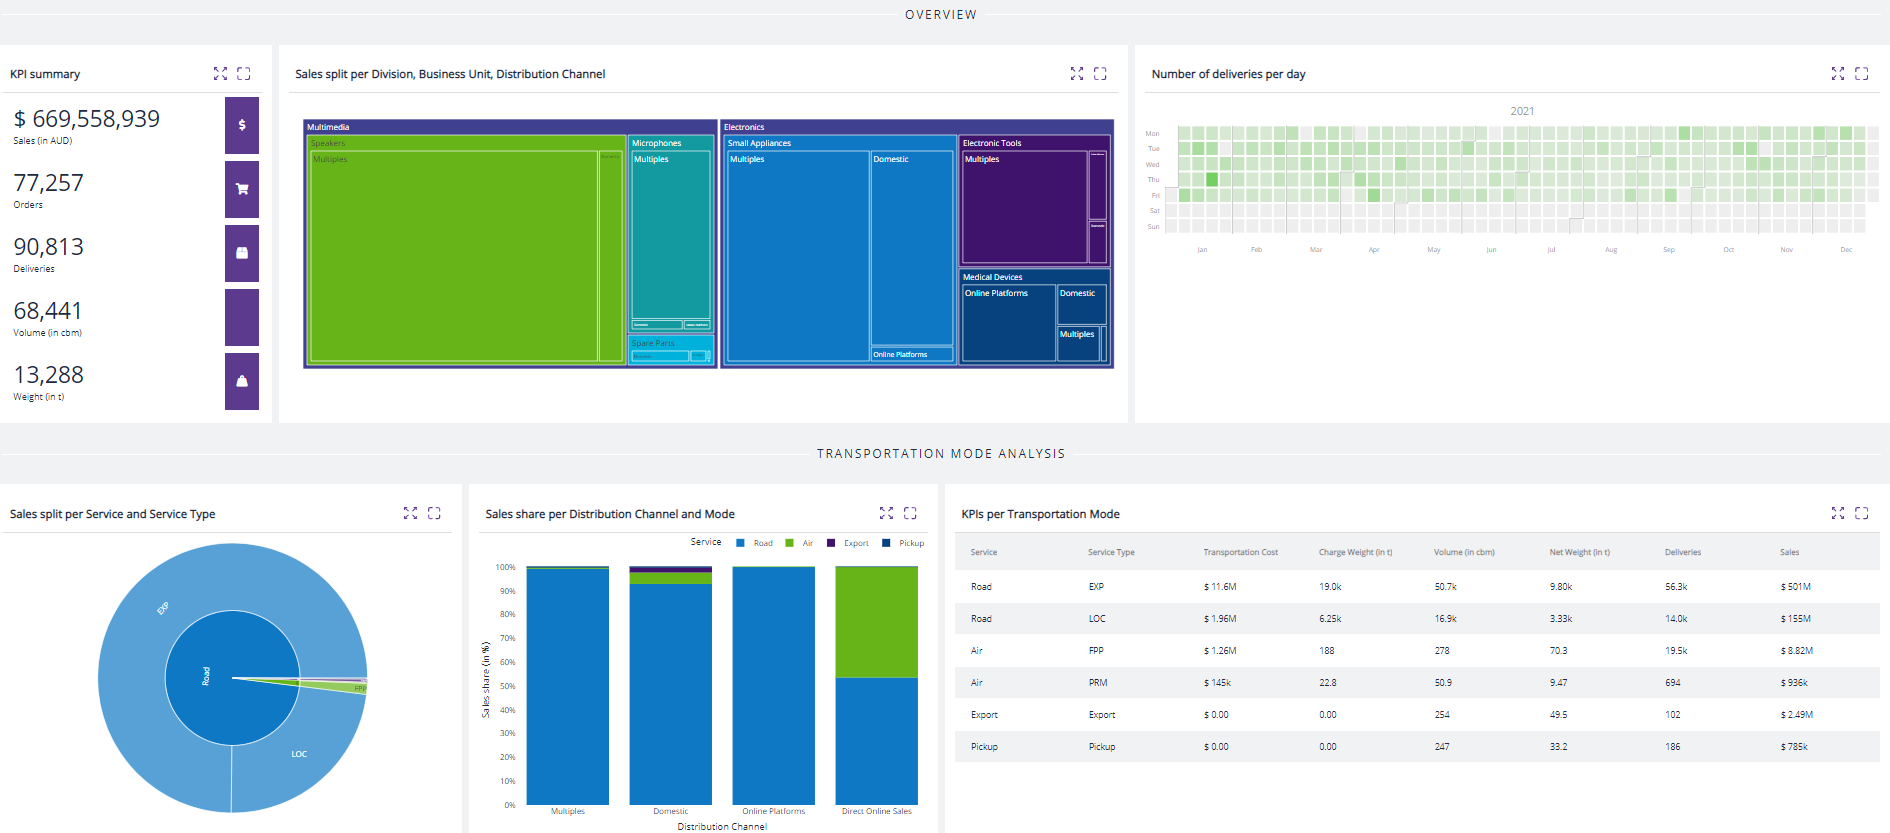
Practitioners now compare 12–15 network scenarios in under an hour, sharpening decisions and management buy-in — with next-day delivery capability materially improved.